Codemaps Leaflet
Codemaps is my project to visualize git repos content using the treemaps visualization technique, available at https://usecodemaps.com/.

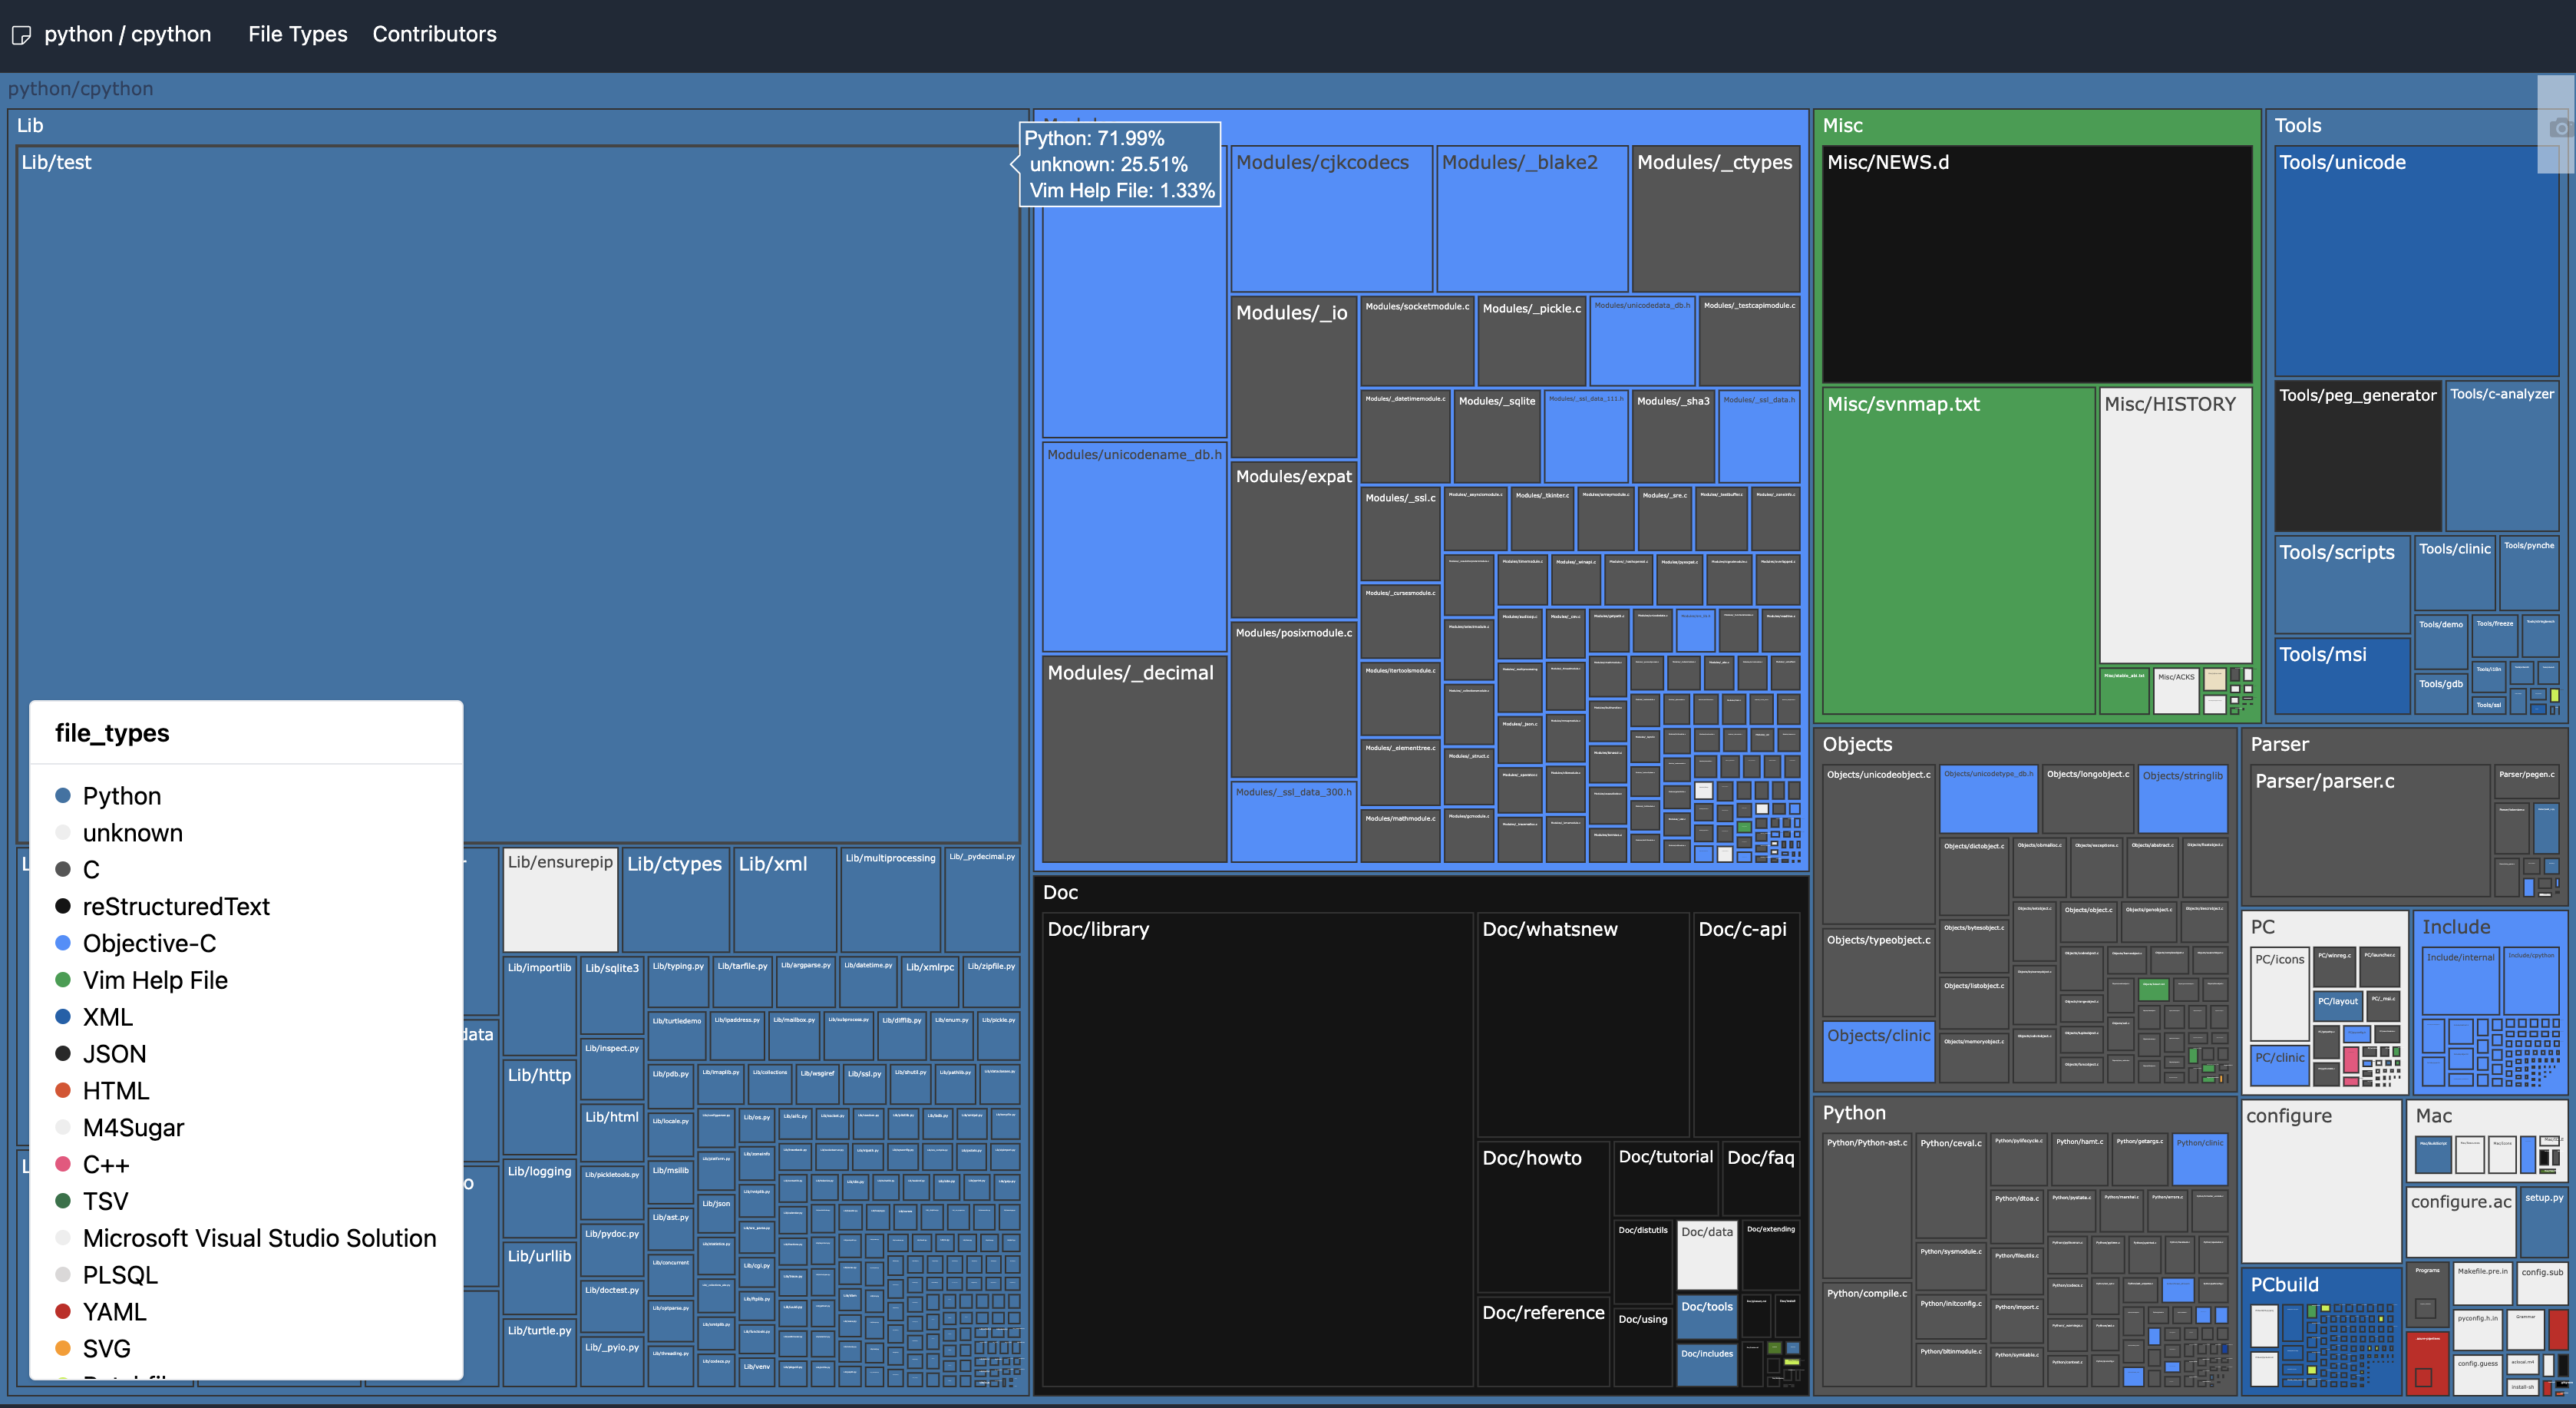
Codemaps of CPython repo
At the moment, it uses plotly treemaps and React Plotly.js to display the maps. I liked how it worked, but I didn’t appreciate how sluggish it was on large repositories. Besides, plotly didn’t let me tweak the visualization part as much as I wanted.
I thought it would be nice to reuse a JavaScript library that shows geographic maps to show the codemaps. The functionality overlap should be enough for me to climb onto their shoulders and take advantage of their out-of-the-box zoom and scale functionality, top-notch performance, etc.
The first attempt was promising. I used squarify and geojson to convert the repo content into a GeoJSON feature set. I represented each directory and file with a GeoJSON polygon annotated with custom properties, kind of like this.
{
  "type": "Feature",
  "id": "tests",
  "geometry": {
    "type": "Polygon",
    "coordinates": [
      [
        [0.0, 0.0],
        [729.653981, 0.0],
        [729.653981, 611.055624],
        [0.0, 611.055624],
        [0.0, 0.0]
      ]
    ]
  },
  "properties": {
    "title": "tests",
    "description": "Python: 87.97%<br>\nVim Help File: 6.35%<br>\nunknown: 3.92%",
    "stroke": "#000000",
    "stroke-opacity": 0.5,
    "stroke-width": 2,
    "fill": "#3572A5",
    "fill-opacity": 0.1,
    "text-color": "#ffffff",
    "has-children": true
  }
}
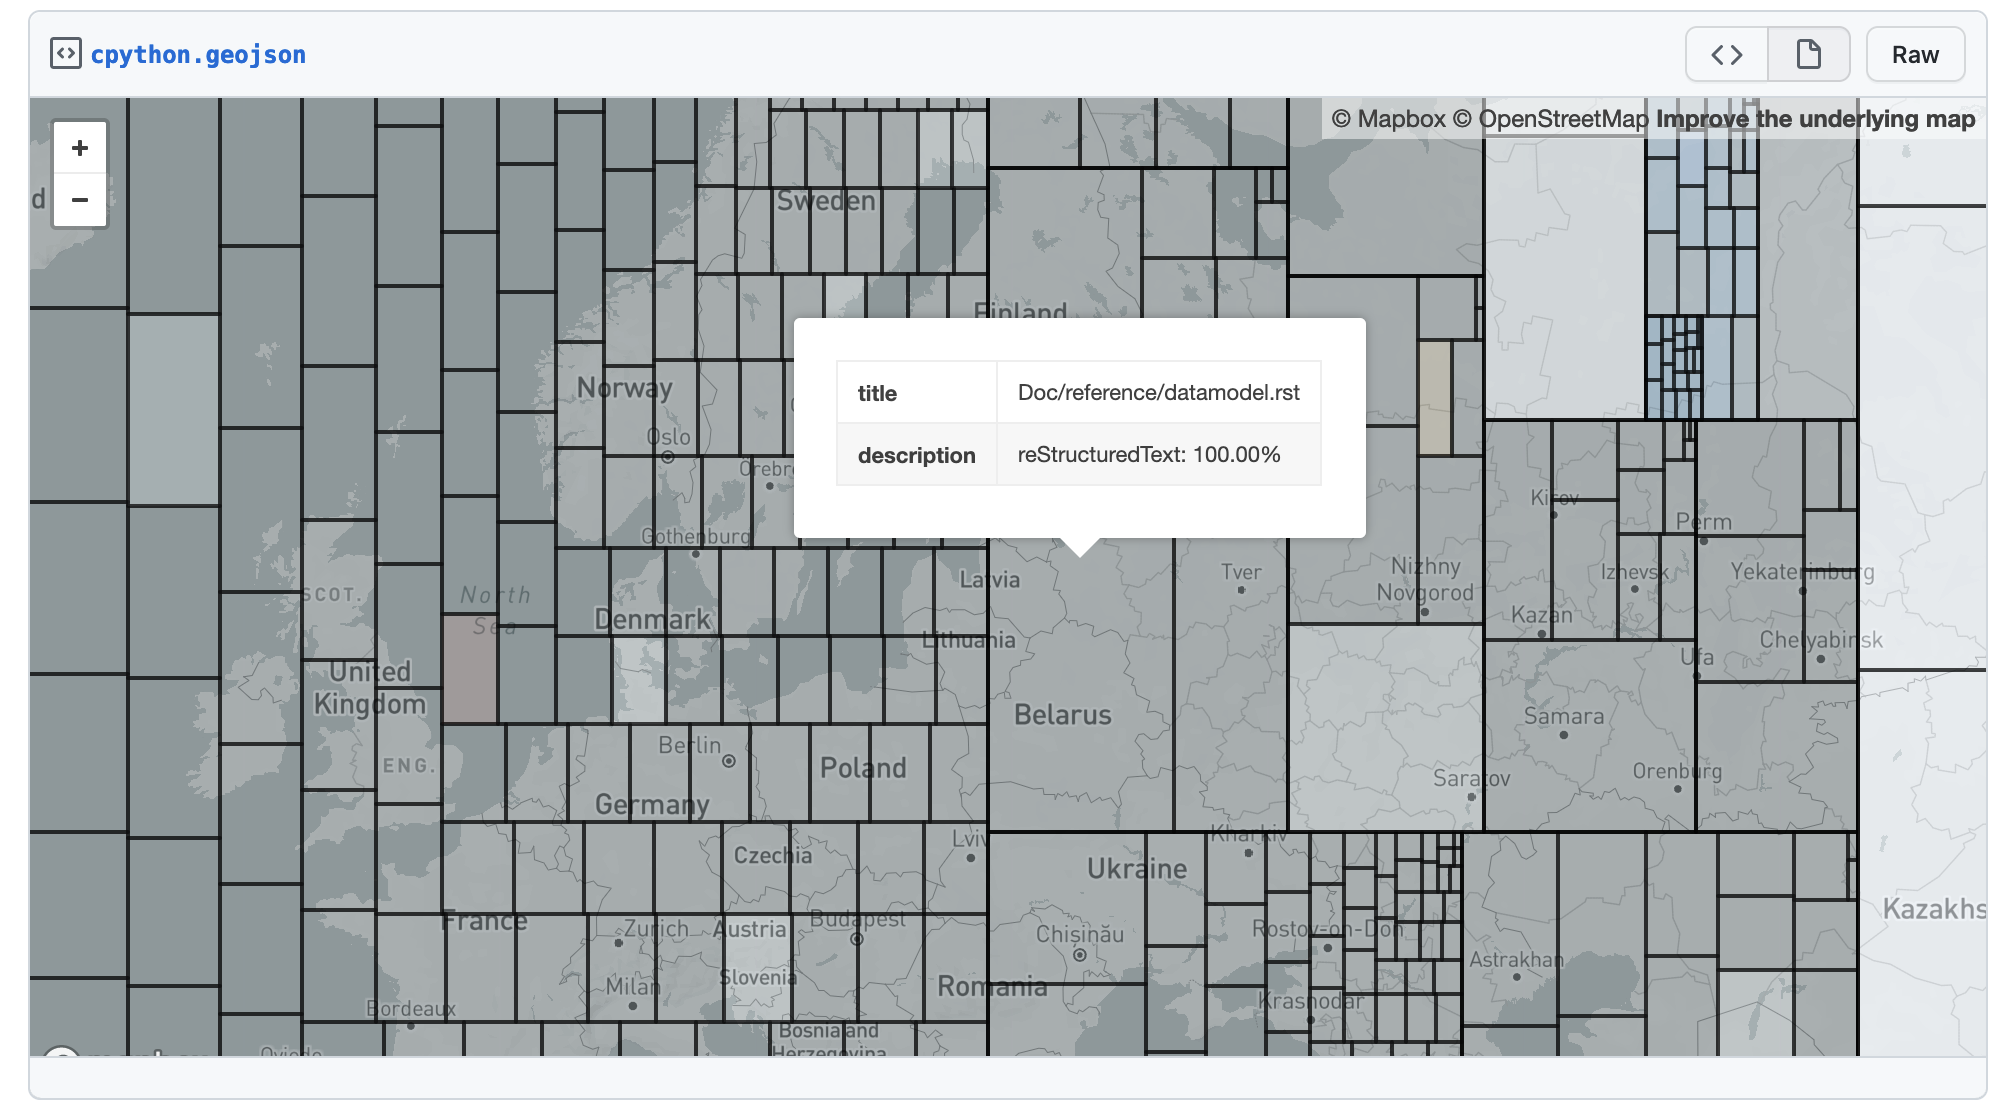
Then I saved the resulting file as a GitHub Gist. GitHub visualizes GeoJSON objects out of the box, and the result was beautiful and snappy. Even the map underneath served the purpose of helping me make jokes like “the codemaps project became truly global.” Look here.

CPython file type codemaps exported as GeoJSON
GitHub uses Leaflet, an open-source JavaScript library for mobile-friendly interactive maps, and I decided to use the same. To make it work with my current project, I used React Leaflet, React components for Leaflet maps. I wanted to hide the map underneath, choose which blocks to show depending on the zoom level, and annotate every rectangle with its name.
Hiding the map was the easiest part. I learned about CRS, the Coordinate Reference Systems, chose the so-called simple CRS that works well for non-geographic maps, and my job there was done.
Hiding and showing components on different Zoom levels was not a challenging task either. The React wrapper around Leaflet made it a breeze.
The real challenge came when I started applying styles to my GeoJSON features. Leaflet provides many different ways to style GeoJSON, but unfortunately, none helps you show titles in rectangles. With a few workarounds and experiments, I learned to find pixel coordinates of rectangles, measure text size in pixels, and apply one to another. Borders, margins, and paddings came later.
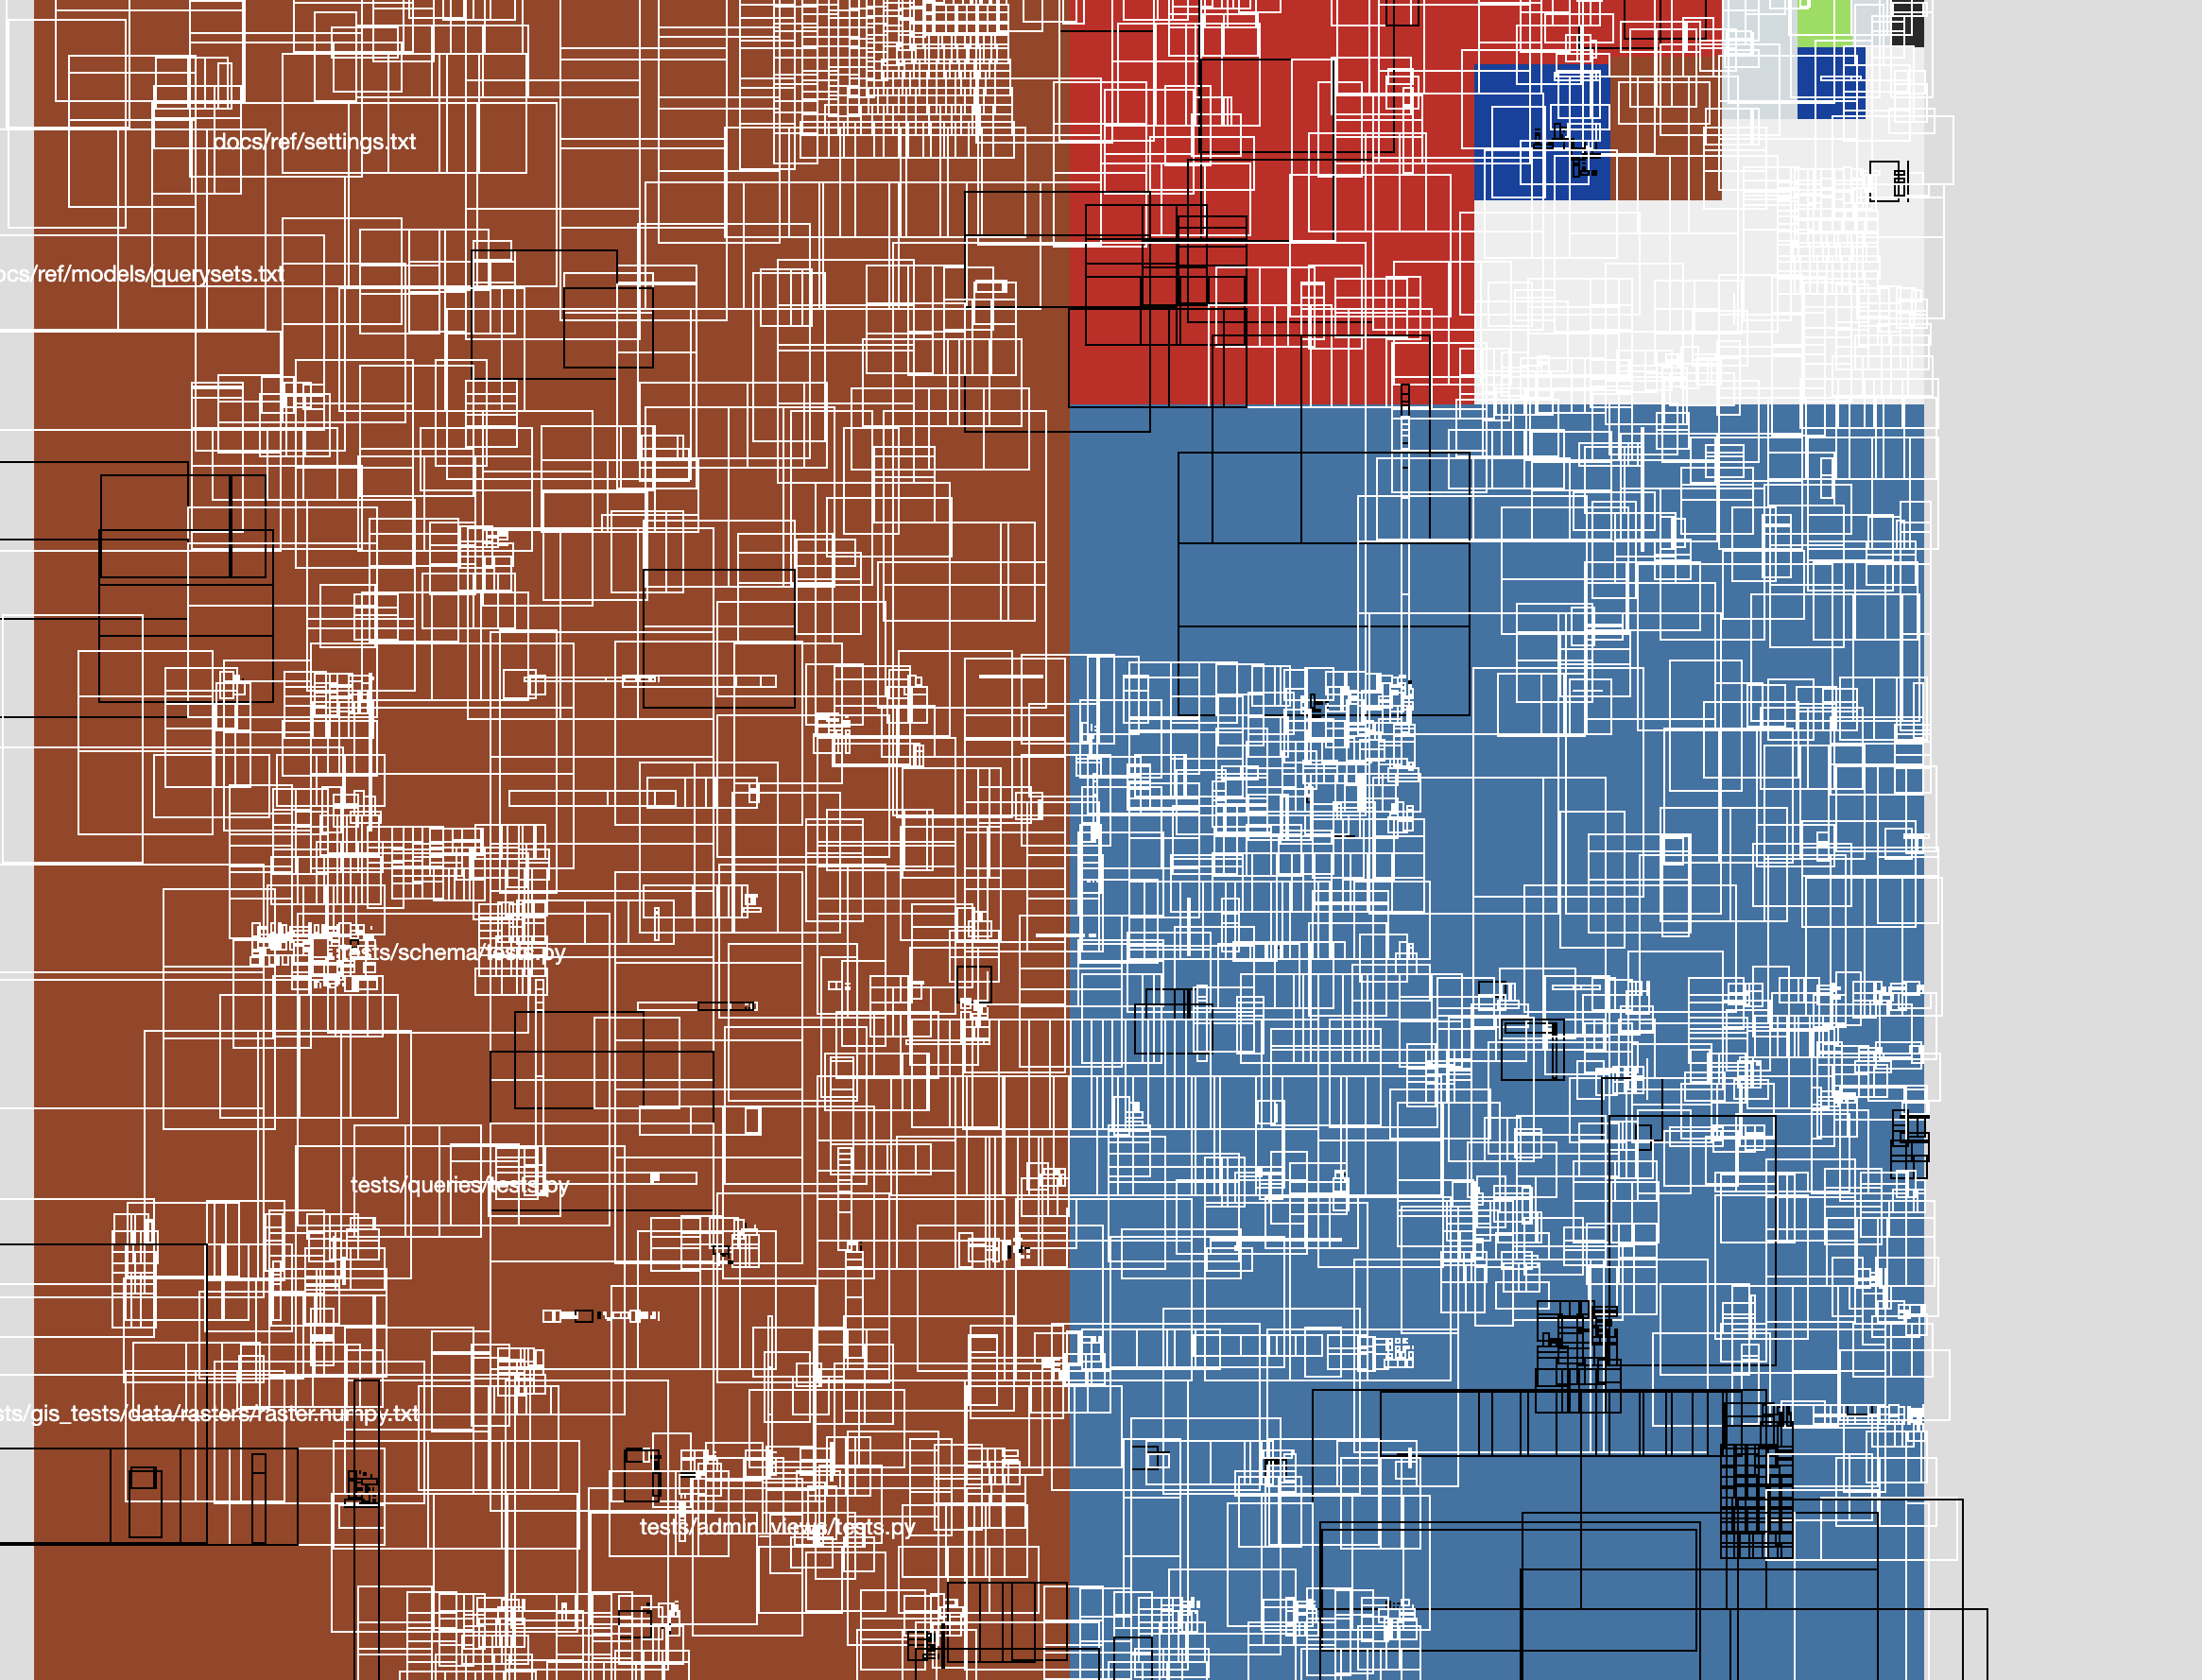
After a few days of bending the Leaflet library to show my codemaps, I understood I had gone too far into the rabbit hole. I was trying to use the library for the purpose it was not designed for. My interface became slower than the original plotly implementation, and I started spending more time fixing bugs than adding new functionality.

One of my attempts to visualize the Django codebase with Leaflet
The experiment was over. I decided that I learned enough about Leaflet, my task, and myself to consider this trio doesn’t play well together. That said, I enjoyed the process and learned one or two things along the way.
- Leaflet is a fantastic library for building interactive maps! I was just trying to use it for the wrong purpose.
- I started understanding people raving about TypeScript and VSCode. They play very well together, and the more I use TypeScript, the more I like it.
- Client-side performance optimization is hard, and there are no workarounds. If something is slow, you can’t scale it horizontally.
The code at https://usecodemaps.com/ is kept untouched. The next stop is the d3 treemap.