Python Performance Profiling
Performance profiling in Python

When it comes to performance, you never know where the bottleneck is. Fortunately, the Python ecosystem has tools to eliminate guesswork. They are easy to learn and don’t require codebase instrumentation or preparatory work.
When I worked at Doist, I spent hours staring at the profiling plots of our full sync API. In Todoist API, full sync is the first command called after a login. In our battle for a smooth experience, we went to great lengths to optimize the first load.
Recently I had a chance to apply this knowledge to my new project. My client had a script pulling data from the API and generating reports from it. A single script run took a few minutes. Every time I tested its behavior, I had to wait long enough to get knocked out of my flow.
Profiling the script revealed the culprit in the most inconspicuous place – the developers had exported the raw dataset to Excel for debugging. Removing a single line of code made the script 10x faster, so I could keep iterating on the codebase without losing my flow.
Collect raw data with cProfile
The profiling exercise has two steps: collect raw data, and explore the collected results. Python’s built-in cProfile module does a great job collecting statistics.
To profile a script, I call it with python -m cProfile -o output.prof. For example, to profile a Django management command and store the profiling results in the output.prof file, I would type something like this:
python -m cProfile -o output.prof ./manage.py migrate
To profile a function, I often use IPython’s %prun magic command (ref). Here’s how I profile a function dep_wikidata() from one of my pet projects.
In [1]: from deputies.core.services.dep_wikidata import dep_wikidata
In [2]: %prun -q -D output.prof dep_wikidata()
The -D flag is to dump the profile output in the machine-readable format.
Explore results with Snakeviz
SnakeViz is a browser-based interactive graphical viewer for the output of cProfile.
Install it with pip install snakeviz, then run it like this:
snakeviz output.prof
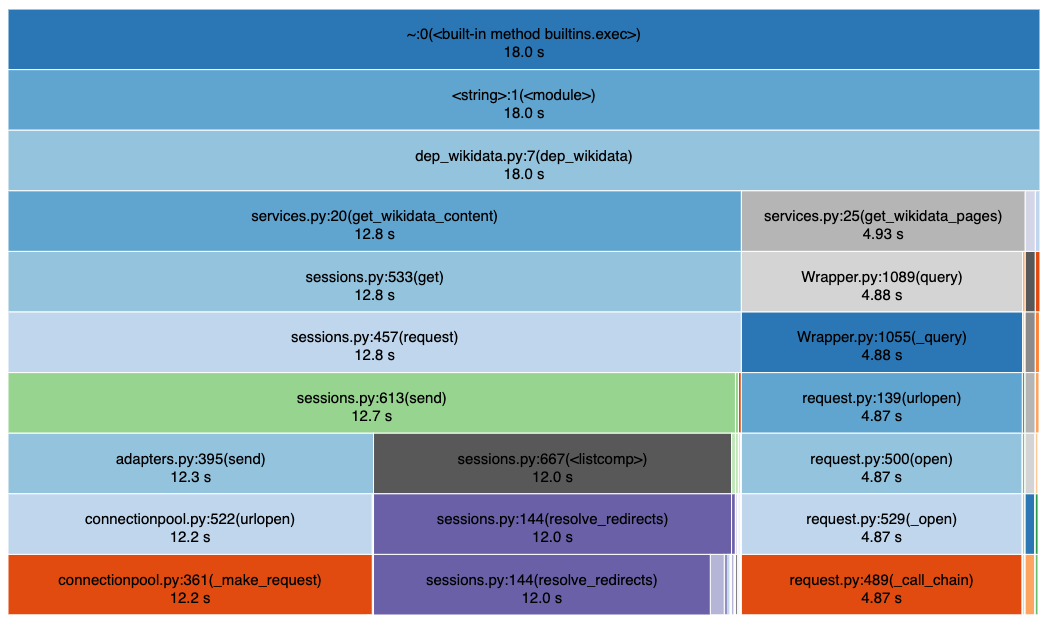
Below is a pretty self-explanatory output of snakeviz. For example, rows 3 and 4 show that the function dep_wikidata() took 12.8 seconds waiting for get_wikidata_content() and 4.93 seconds waiting for get_wikidata_pages().

Snakeviz output for dep_wikidata()
cProfile pitfalls
The built-in profiler is a great tool but has its caveats. Its performance impact on the executing code is substantial. Therefore, absolute values in the benchmark results make little sense. I’ve noticed a 2-5x slowdown due to profiling.
More importantly, the performance effect of the profiler may not be evenly distributed throughout your code, and the results can be misleading. A few times, I spent hours trying to micro-optimize slowdowns in unexpected places just to discover that these issues were mere profiler artifacts.
Flame graphs
A flame graph is another way to collect and visualize stack traces to profile your program. They were invented in 2011, and the author used them to discover MySQL performance issues. Since then, they have been widely adopted in different contexts.
Flame Graph example that shows MySQL codepaths that are consuming CPU cycles.
The flame graph is sort of like the snakeviz output turned upside down. The x-axis shows the stack profile population, sorted alphabetically, and the y-axis shows stack depth, counting from zero at the bottom. Each rectangle represents a stack frame. The wider a frame is, the more often it was present in the stacks.
You can read more about Flame graphs here or watch an insightful presentation from the author.
Statistical profiling in Python
Flame graphs belong to a class of statistical (not deterministic) profilers. The Python ecosystem provides various tools to collect such statistics and visualize them with flame graphs.
Create manually. One way to generate a profile from Python is to run a thread that takes a snapshot of what’s executed in the main thread. The function sys._current_frames() can get access to the guts of executable processes.
A few years ago, when I needed a flame graph, I used snippets from python-flamegraph to write my inspector. To collect data in production as necessary, I used Redis Pub/Sub events to start and stop the collecting thread.
py-spy. These days, I use py-spy for the same purpose. Frankly, py-spy feels like magic! It doesn’t run in the same process as the profiled Python program. Instead, you pass the PID of your script or process. It explores its running state, decodes the frames, and collects high-level statistics. Py-spy can generate flame graphs and reports for speedscope, an interactive visualizer for flame graphs.
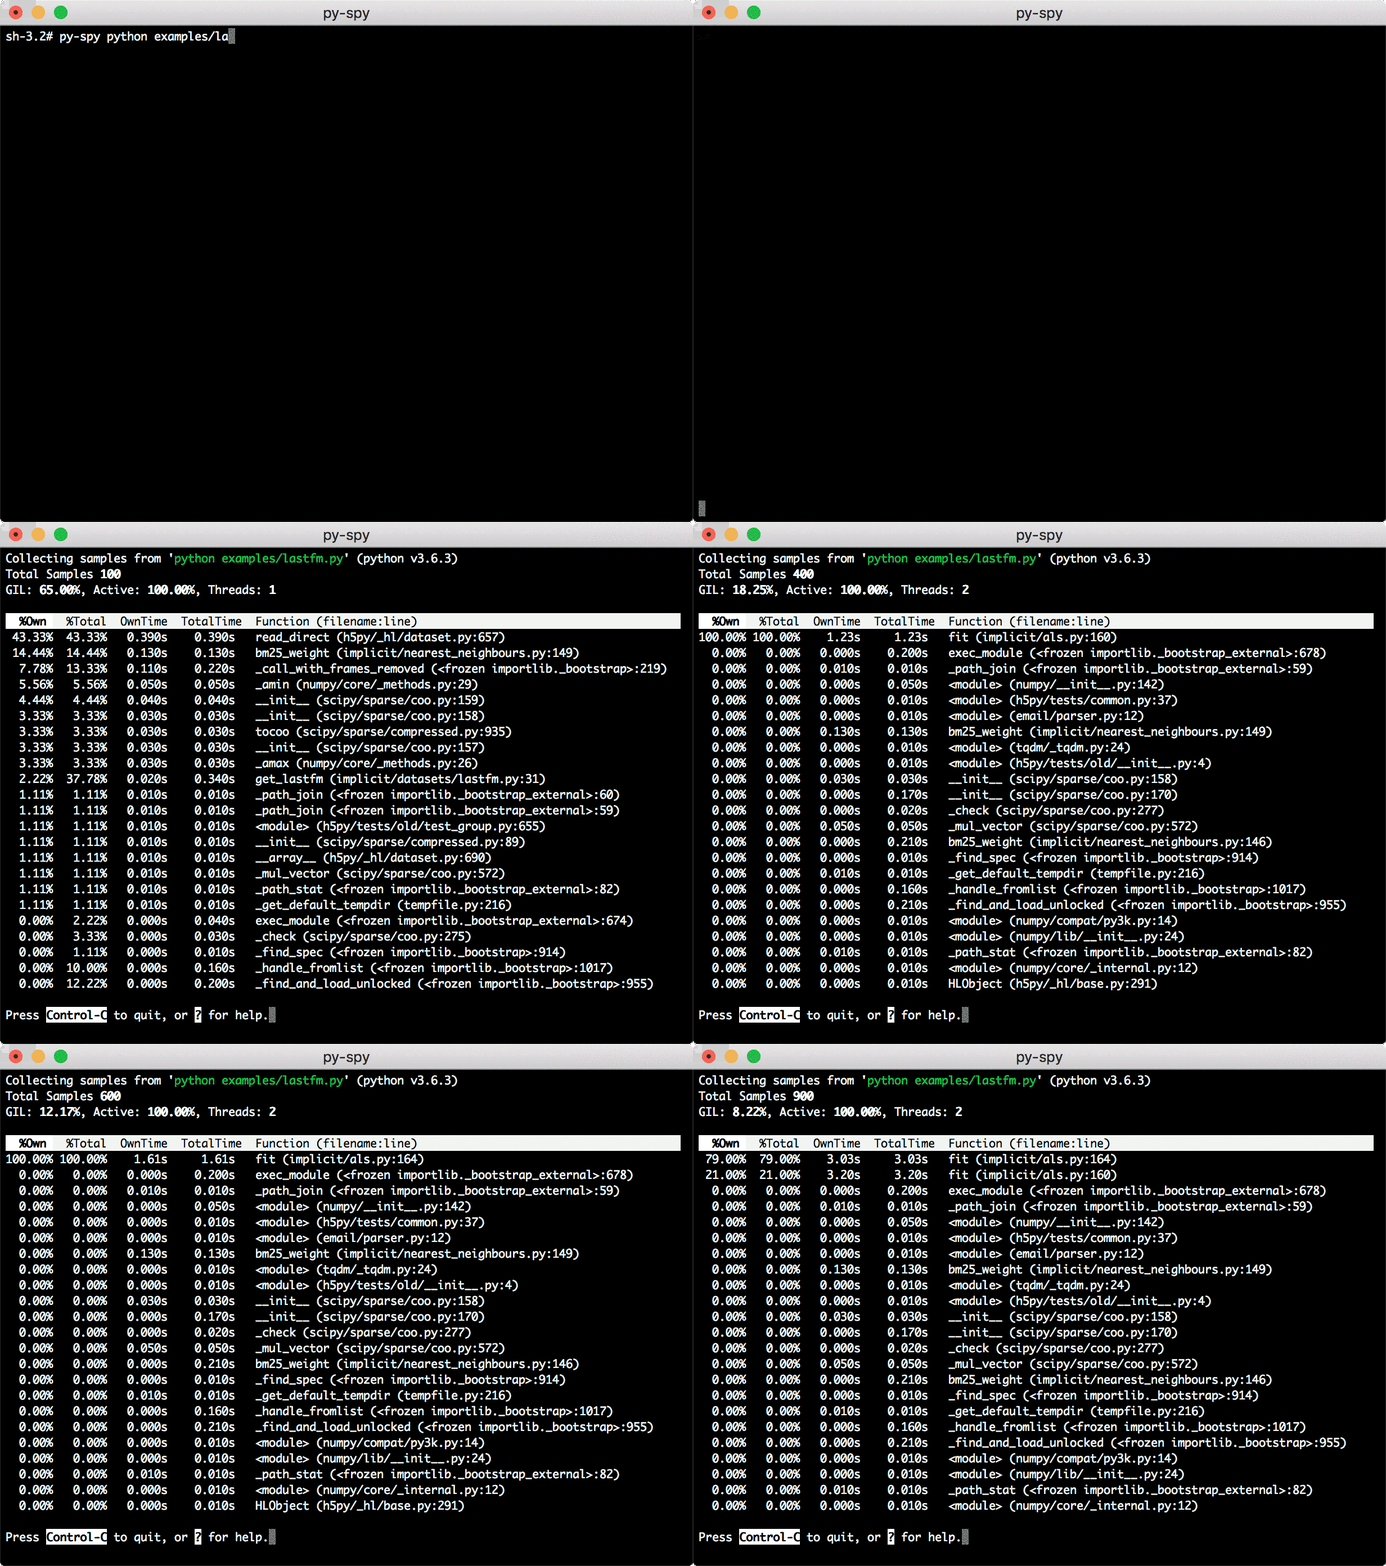
It also provides a top-like interface for real-time insights.

py-spy top collects real-time statistics for a running process
pyinstrument is another statistical profiling project. You cannot run it in a separate process, like py-spy, but it has a nice API and is easy to integrate with web frameworks, such as Django and Flask. With the low overhead, pyinstrument is an ideal tool for the production environment. I haven’t had a chance to use it yet, but I’ll surely give it a try at my next opportunity.